metagRoot - How to use

The metagRoot application provides a comprehensive and interactive platform for exploring protein families within plant root microbiomes. Users can investigate microbial protein data derived from metagenomic, metatranscriptomic, and reference genome sources, enriched with structural, functional, and ecological context. The application includes a suite of advanced search and visualization tools to support hypothesis generation, annotation, and comparative analysis.
The available features are summarized below:
- Welcome: The application home page, introducing metagRoot’s scope and functionality.
-
A. User Interface Overview: The top navigation bar provides access to all main features, including:
- Browse: Explore protein families.
- Sequence Search Tools: Search using sequences or motifs.
- Statistics: View summary statistics of the database.
- Downloads: Access downloadable resources.
- Contact: Contact information.
- Manual: You're here!
- B. Family Search Box: This search bar allows you to directly look up one or multiple protein families by entering their IDs (e.g., F000292, F000581), separated by commas.
- C. Browse Families Button: Clicking this button redirects you to the full Browse → Families page, where filtering options for all protein families are available.
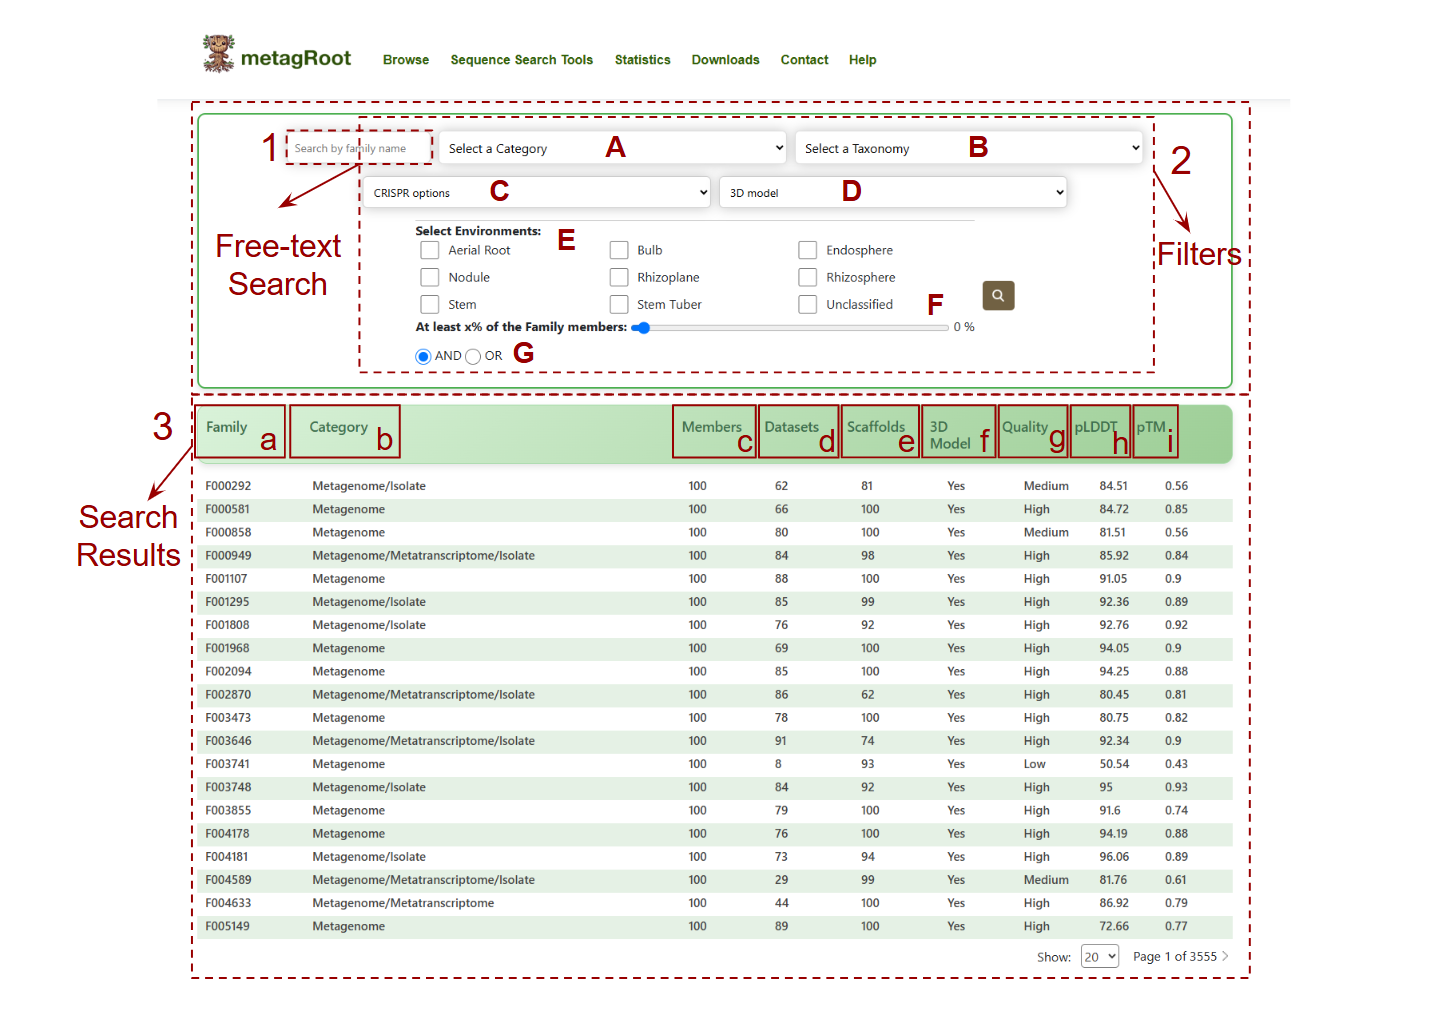
Navigate to Browse → Click on Families to access the search interface.
Search Options:
- 1.Free-text Search: Enter family identifiers or keywords.
-
2.Filters:
- A. Sequence Category: Metagenome-only, Metatranscriptome-only, Mixed, or All.
- B. Taxonomy: Filter by taxonomic classification.
- C. Presence of CRISPR-arrays and/or cas domains.
- D. 3D Model: Filter protein families based on the availability of predicted 3D structural models (Yes/No).
- E. Ecosystem: Select specific habitats like Rhizosphere, Nodule, etc.
- F. Minimum Members Slider: Set a threshold for the percentage of sequences in a family.
- G. AND/OR Logic Toggle: Combine environments using logical operators.
-
3.Search Results:
- a. Family: Unique identifier for each protein family (e.g., F000292).
- b. Category: Sequence origin—Metagenome, Metatranscriptome, Isolate, or combinations.
- c. Members: Total number of protein sequences in the family.
- d. Datasets: Distinct datasets contributing to the family.
- e. Scaffolds: Number of scaffold sequences associated with the family.
- f. 3D Model: Indicates whether a 3D structure model is available (Yes/No).
- g.
Quality: Predicted model quality:
- High: pTM ≥ 0.7
- Medium: pTM between 0.5 and 0.7
- Low: pTM < 0.5
- h. pLDDT: Shows the average per-residue confidence score (predicted Local Distance Difference Test) from AlphaFold2, reflecting model reliability.
- i. pTM: Displays the predicted Template Modeling score, estimating the overall accuracy of the 3D protein fold.
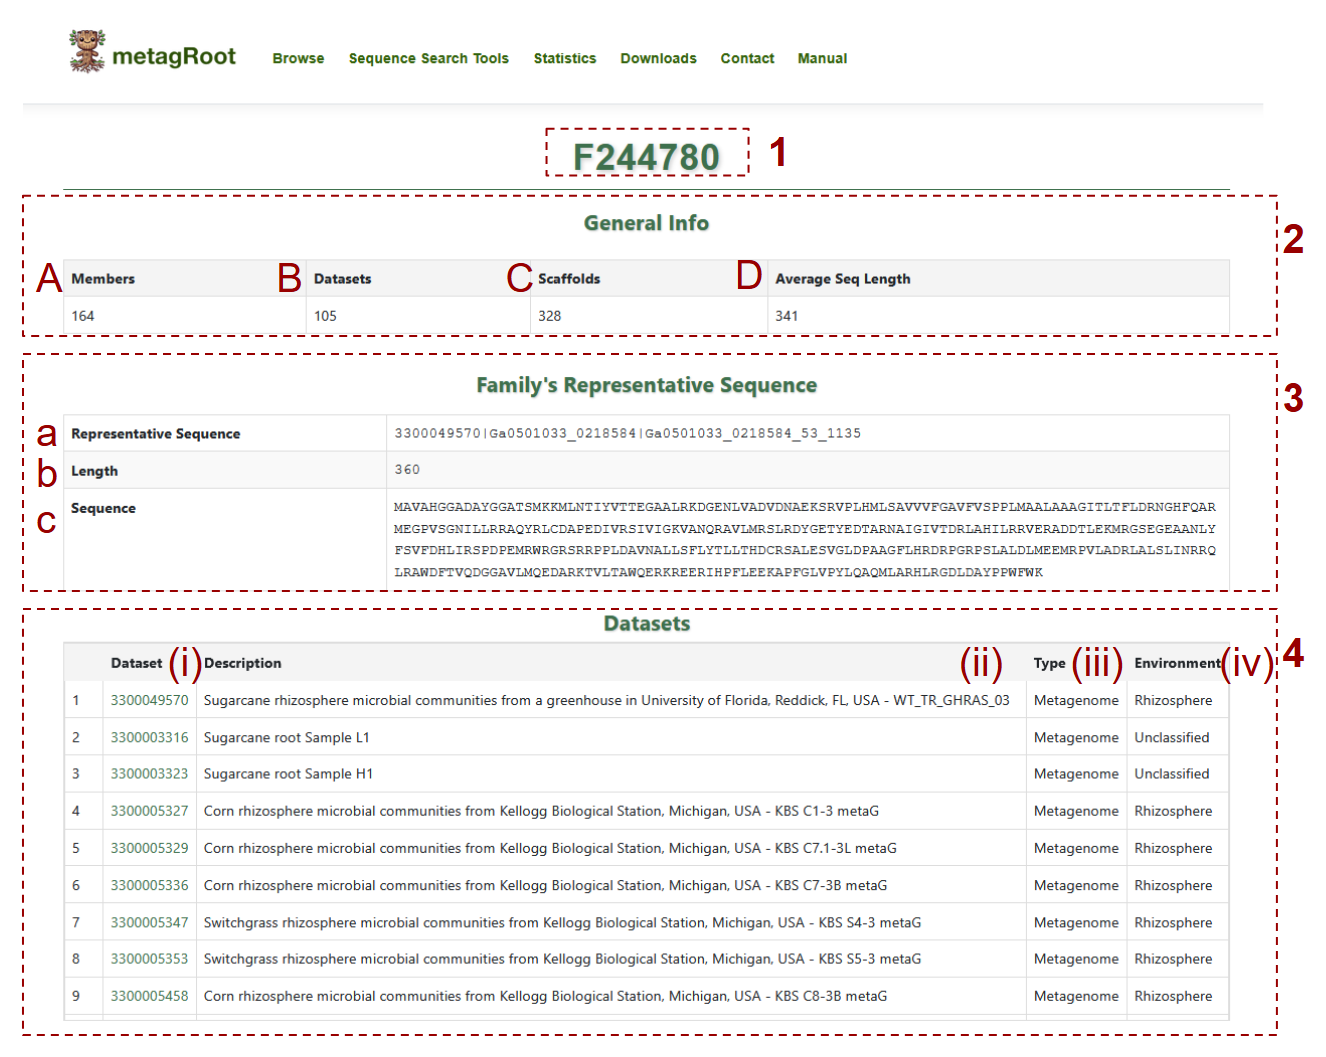
- 1. Displays the unique identifier for the selected protein family (e.g., F244780)
-
2. Provides general statistics for the family:
- (A) Members: How many proteins are included in the family
- (B) Datasets: Number of distinct datasets contributing to the family
- (C) Scaffolds: Number of scaffold sequences in the family
- (D) Average Seq Length: Average length of protein sequences
-
3. Shows the family's representative sequence metadata
- (a) Representative Sequence: The unique identifier of the representative protein
- (b) Length: The total length of the representative protein in amino acids
- (c) Sequence: The full amino acid sequence
-
4. Lists datasets contributing to the family:
- (i)Dataset: Dataset ID with link to IMG/m
- (ii)Description: Corresponding organism name, indicating whether it originates from a reference genome or providing the sample name if derived from a metagenome or metatranscriptome
- (iii)Type: Dataset type such as metagenome, metatranscriptome or reference genome
- (iv)Environment: The environmental source such as rhizosphere or nodule
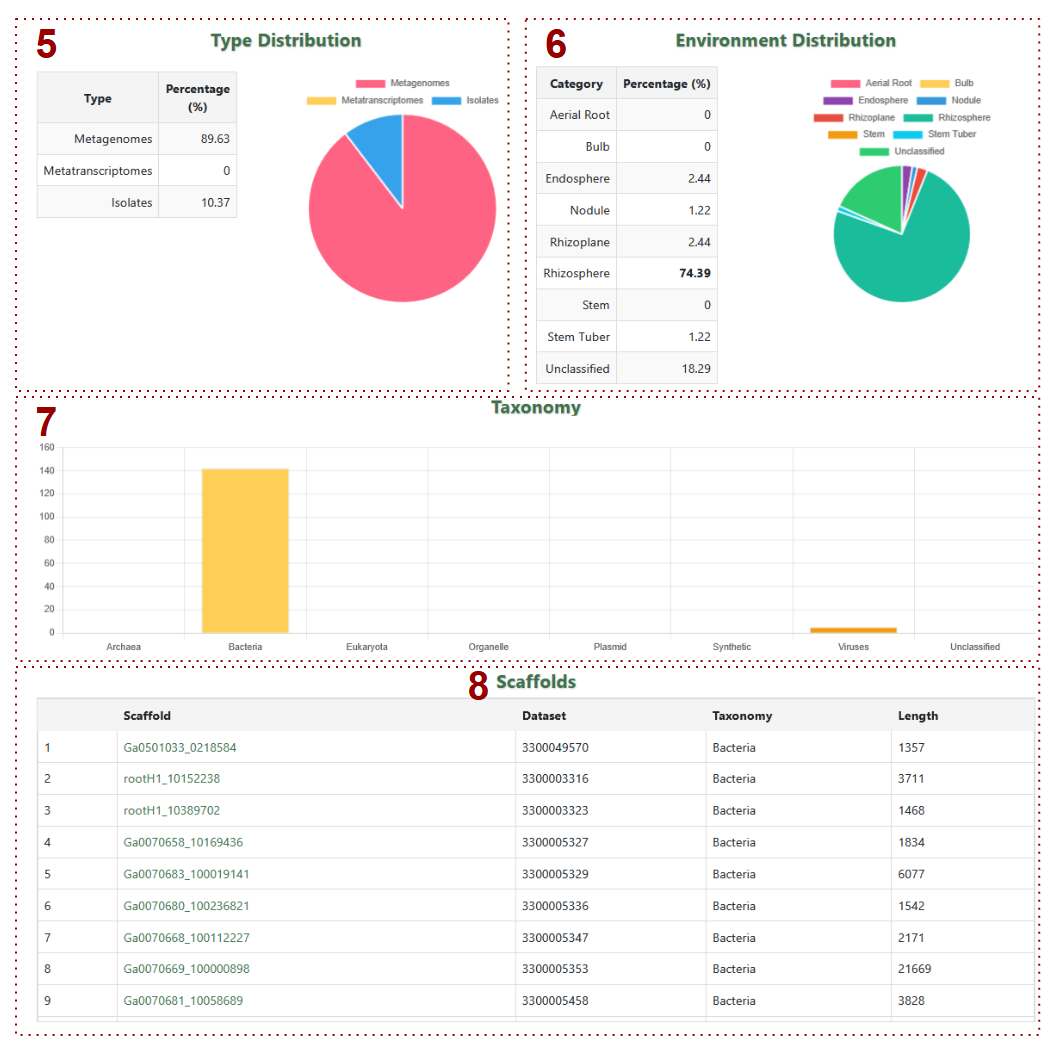
- 5. Type Distribution: Pie chart + summary table for metagenome/metatranscriptome/isolate percentages
- 6. Environment Distribution: Chart showing environmental source percentages
- 7. Taxonomy: Bar graph of taxonomic classifications
-
8. Scaffolds: Table includes:
- a. Scaffolds: Scaffold IDs
- b. Dataset: Dataset IDs
- c. Taxonomy: Taxonomy Classification
- d. Length: Sequence length in base pairs

-
9. MSA Aligner:Allows users to view aligned and non-aligned protein sequences of the family in the Multiple Sequence Alignment (MSA) panel
- a. Use these buttons to switch the sequence view format (aligned/non-aligned).
- b. Displays the color-coded MSA of all protein sequences in the family, supporting sorting, filtering, and visual customization.
- c. Buttons to download the raw or aligned protein sequences in FASTA format.
-
10. Family Sequences: Lists individual proteins within the family, including:
- A. Sample: Sample identifier the sequence comes from.
- B. Scaffold: Scaffold ID where the protein is encoded.
- C. Protein: Protein ID.
- D. Protein Length: Length of the protein in amino acids.
-
11. Functional Annotation (Pfam): Provides Pfam domain information for the family, including:
- i. Pfam ID: Pfam domain identifier.
- ii. Name: Domain name.
- iii. Description: Functional description.
- iv. Start position of the domain on the sequence.
- v. End position of the domain on the sequence.
- vi. Accuracy score (confidence) of the domain prediction.
-
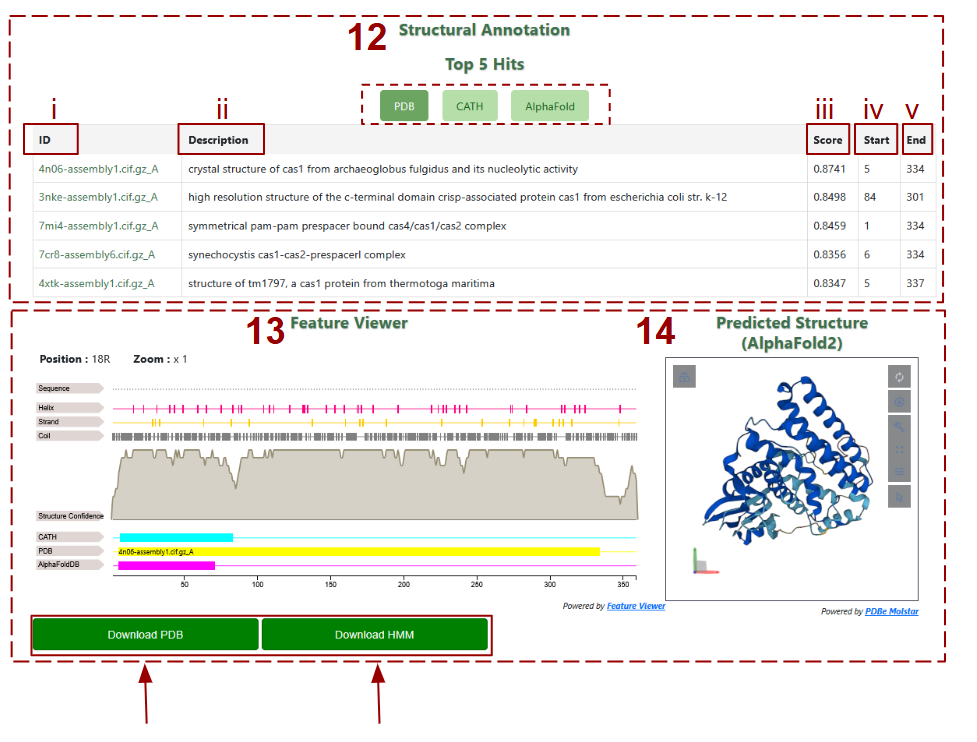
12. List of the top five structural matches to the representative protein from the PDB, CATH, and AlphaFold databases, by clicking on the desired database.
- i. ID: The identifier of the matching structural entry (e.g., PDB file name).
- ii. Description: Brief annotation of the structure, typically indicating protein name and origin.
- iii. Score: Structural alignment score (e.g., TM-score), indicating similarity between the predicted and reference structures.
- iv. Start: Amino acid positions where the structural alignment begins on the query protein.
- v. End: Amino acid positions where the structural alignment ends on the query protein.
- 13. Feature Viewer: An interactive visualization of structural features across the protein sequence, including secondary structure elements (helix, strand, coil), confidence scores, and alignment tracks from CATH, PDB, and AlphaFold.
- 14. Predicted Structure: Display of the 3D ribbon model of the family’s predicted structure rendered by AlphaFold2, with interactive rotation and zoom tools. You can also download the pdb files and HMM profile by clicking at the buttons
-
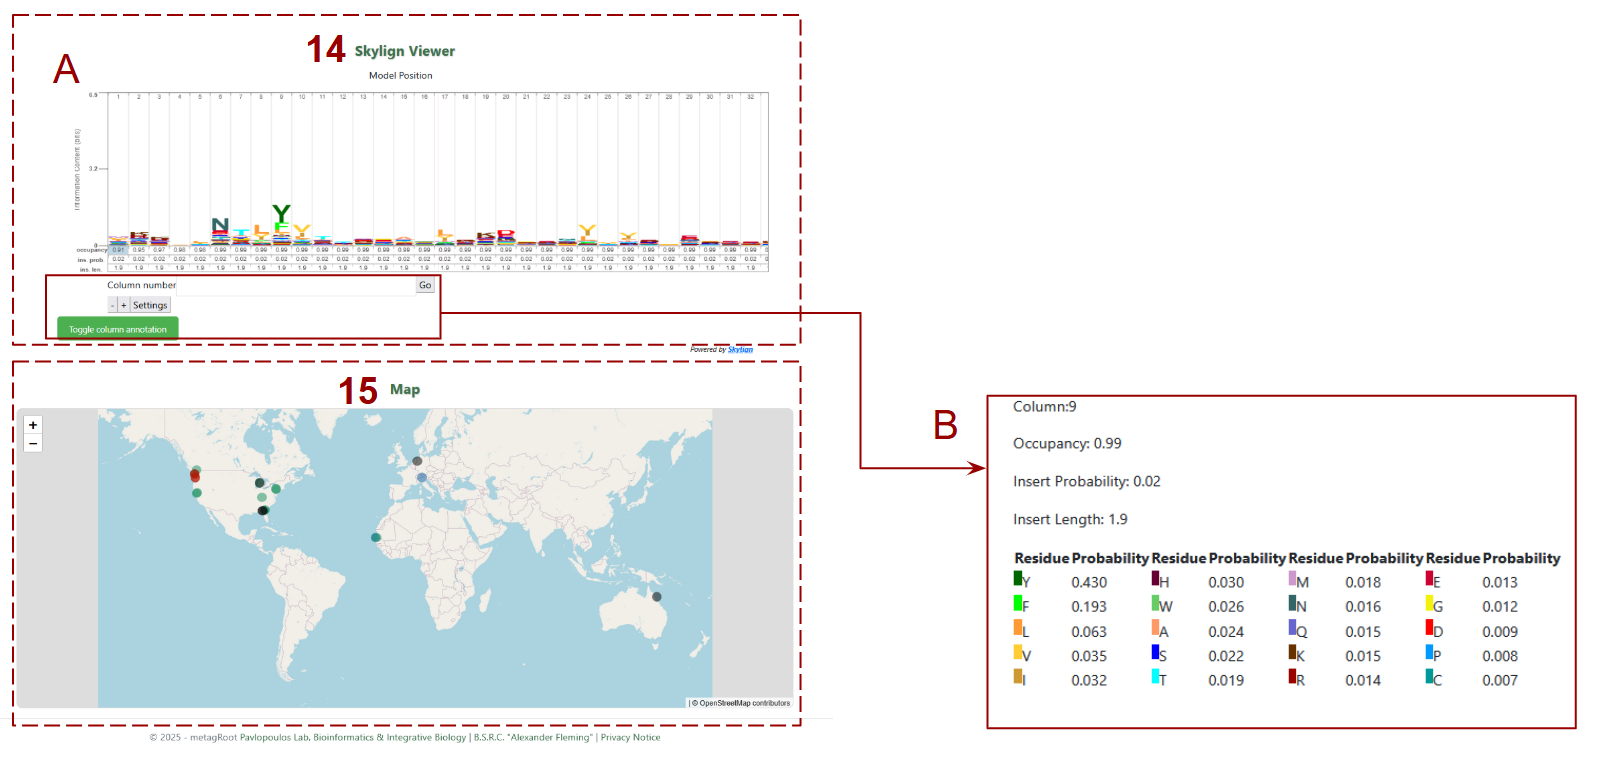
15. Skylign Viewer:
- A. Sequence logo representing the Hidden Markov Model (HMM) profile of the protein family, showing residue conservation, occupancy, and variability at each alignment position.
- B. Column Details : When hovering over or selecting a column in the Skylign Viewer, this panel reveals detailed statistics for that alignment position, including occupancy, insertion probability, and amino acid frequency.
- 16. Map: Shows the global distribution of datasets contributing to the selected protein family using interactive markers, allowing users to visualize geographic origins of the sequences.
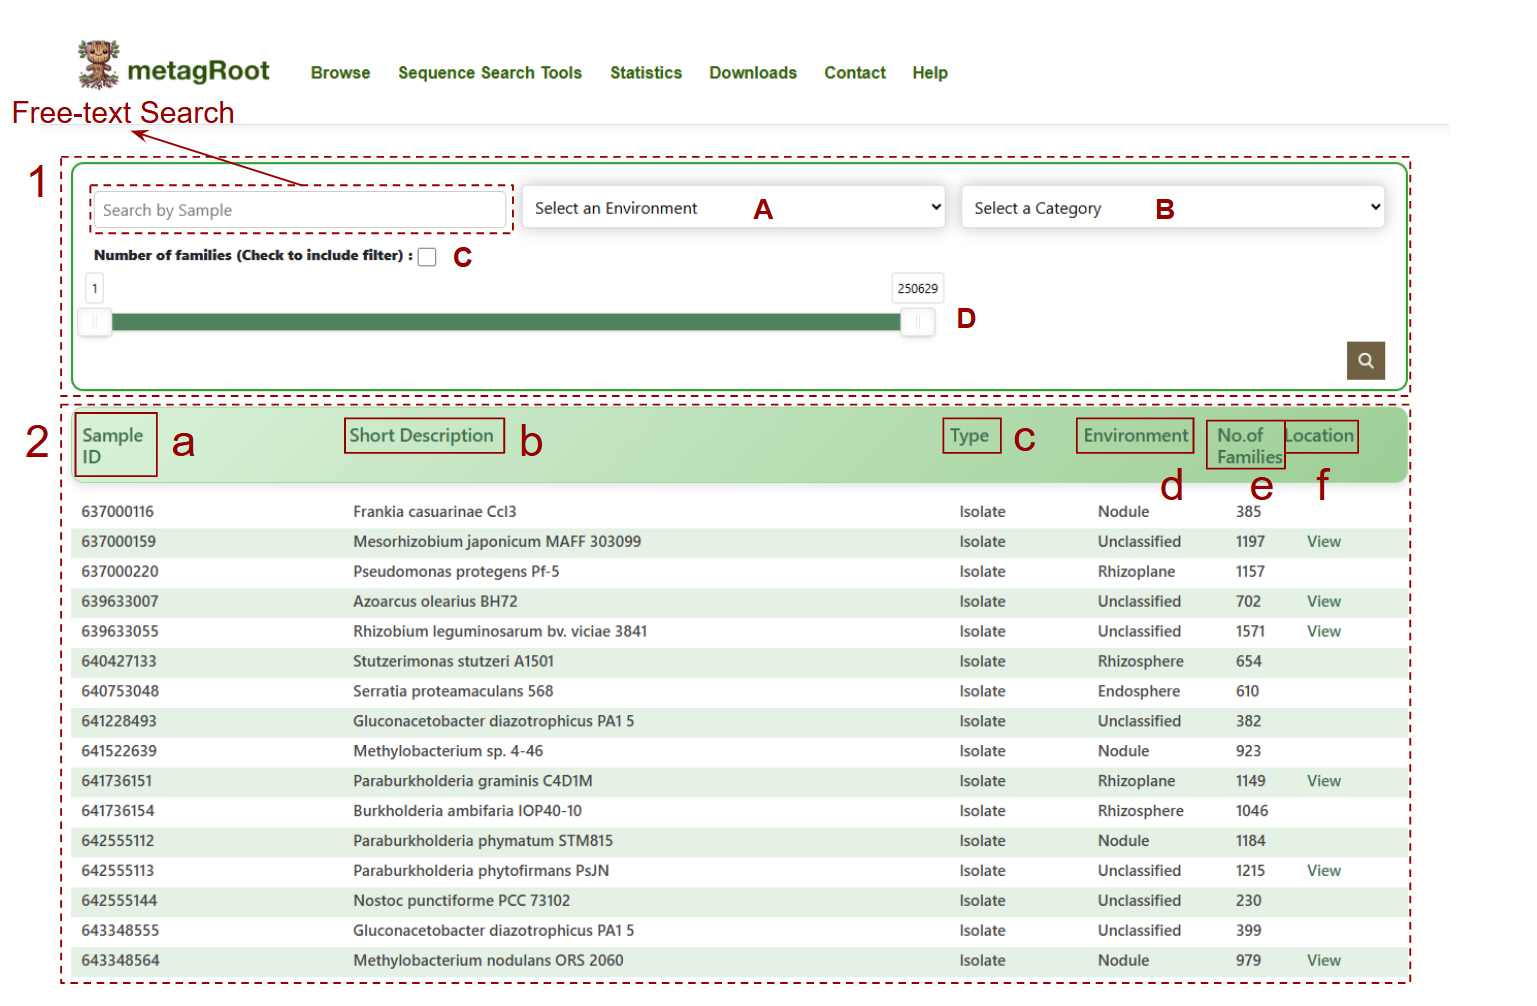
- 1. Free-text search: Enter dataset identifiers
- 2. Dataset table presents:
-
3.Dataset information table:
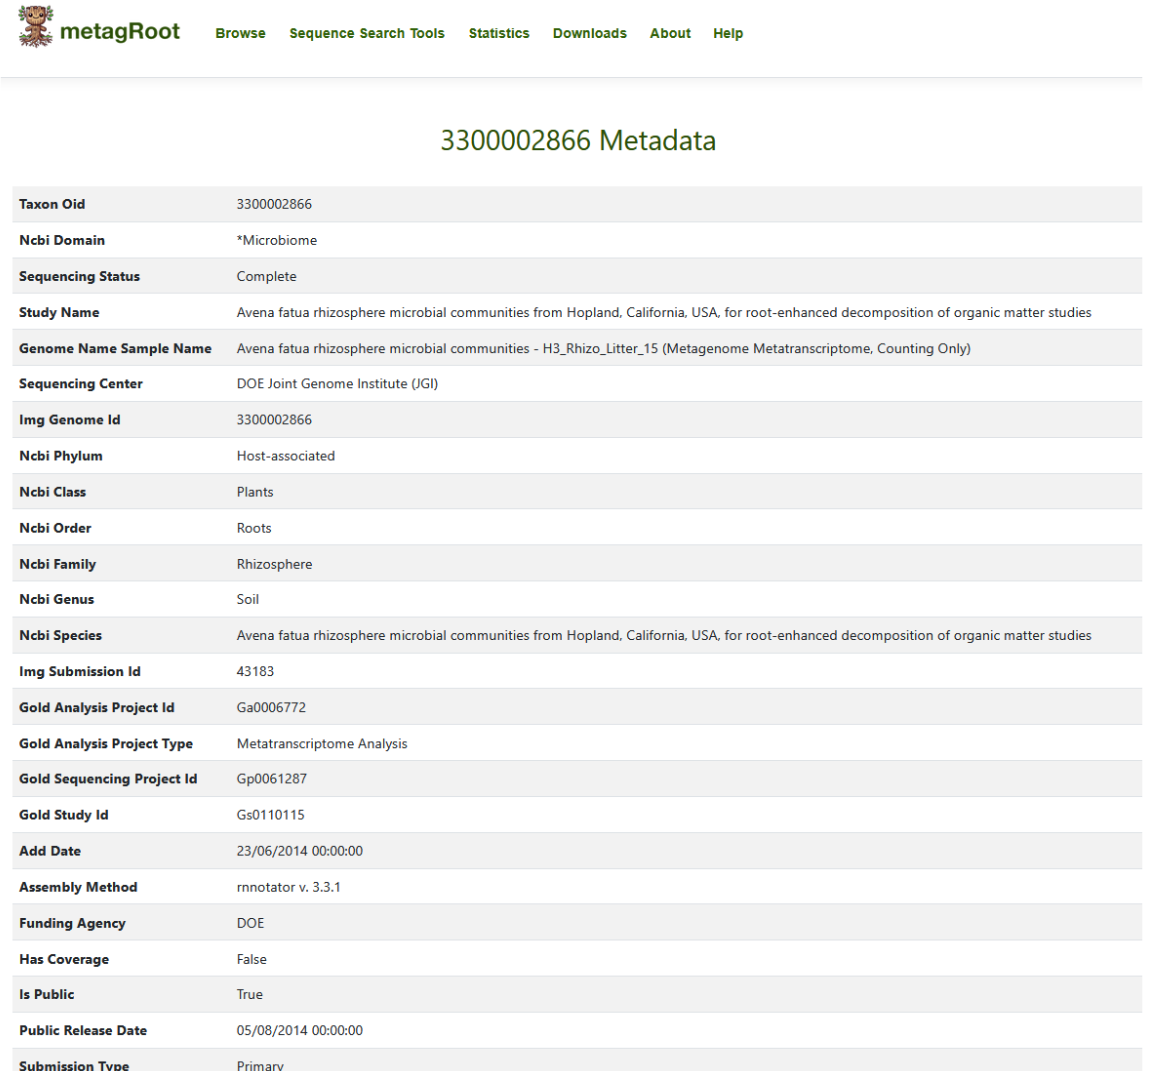
- a. Sample ID linked to a page containing additional information retrieved from IMG/M
- b. Corresponding description in the second column,organism name, if it originates from a reference genome or sample name if derived from a metagenome or metatranscriptome
- c. Type indicates the sample type (e.g., Isolate, Metagenome, Metatranscriptome), showing the origin of the sequences
- d. The environment column specifies the habitat or ecosystem from which the sample was derived
- e. The number of families in which this sample appears
- f. Contains a View link that lets you explore the geographical location of the samle
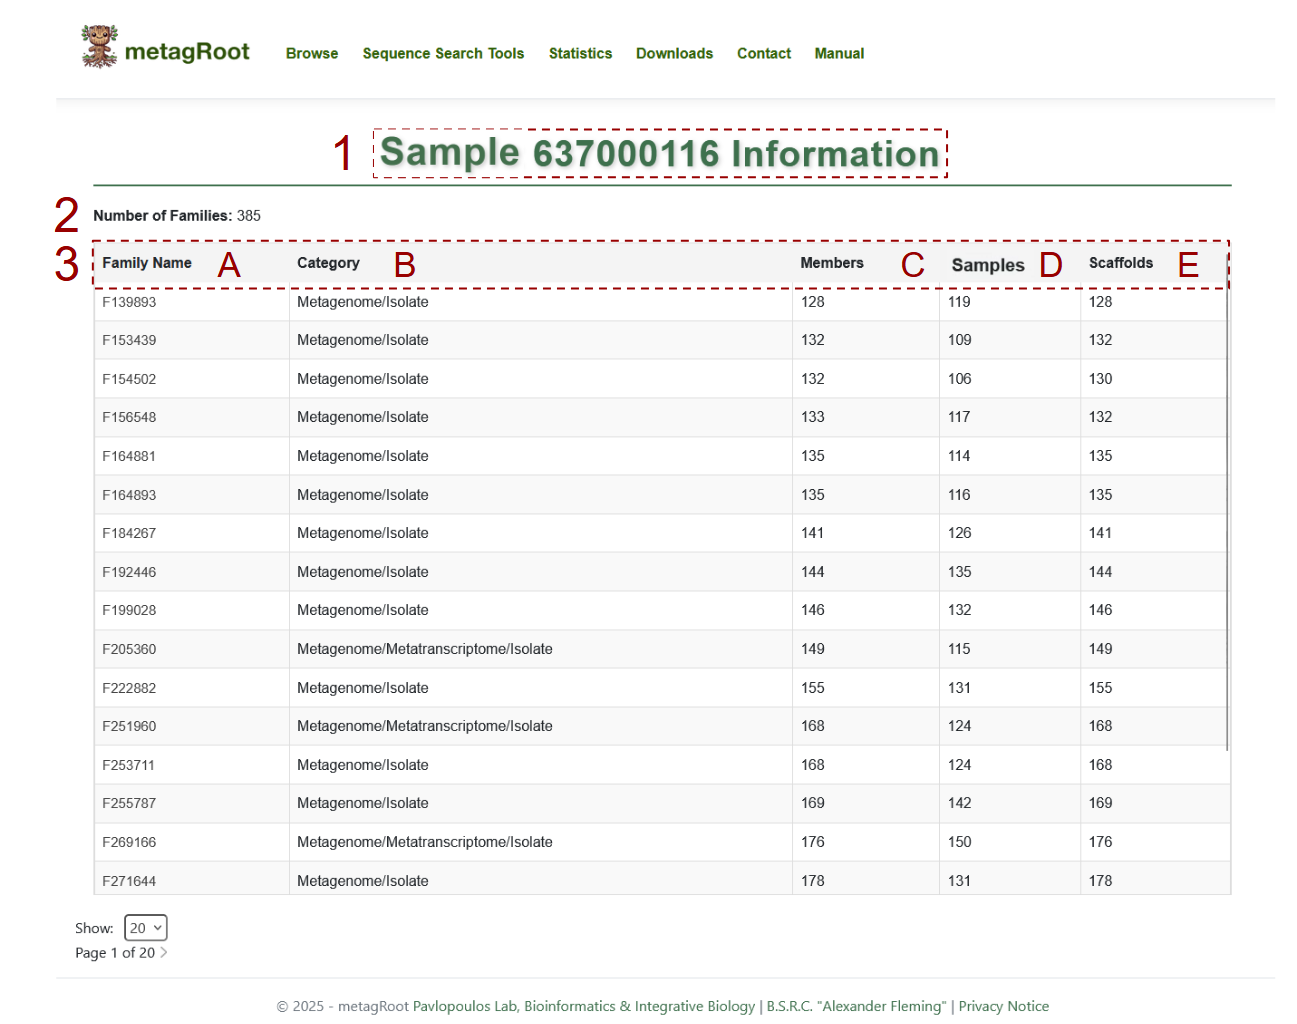
- 1. The selected sample unique identifier
- 2. Families including the selected dataset
-
3. Dataset information table:
- A. Family Name: The unique identifiers of all protein families associated with the dataset.
- B. Category: The source type of sequences in each family, such as Metagenome, Metatranscriptome, Isolate or combinations.
- C. Members: The total number of protein sequences in each family.
- D. Samples: How many samples contribute sequences to the given family.
- E. Scaffolds: The number of distinct scaffolds associated with each family in the dataset..
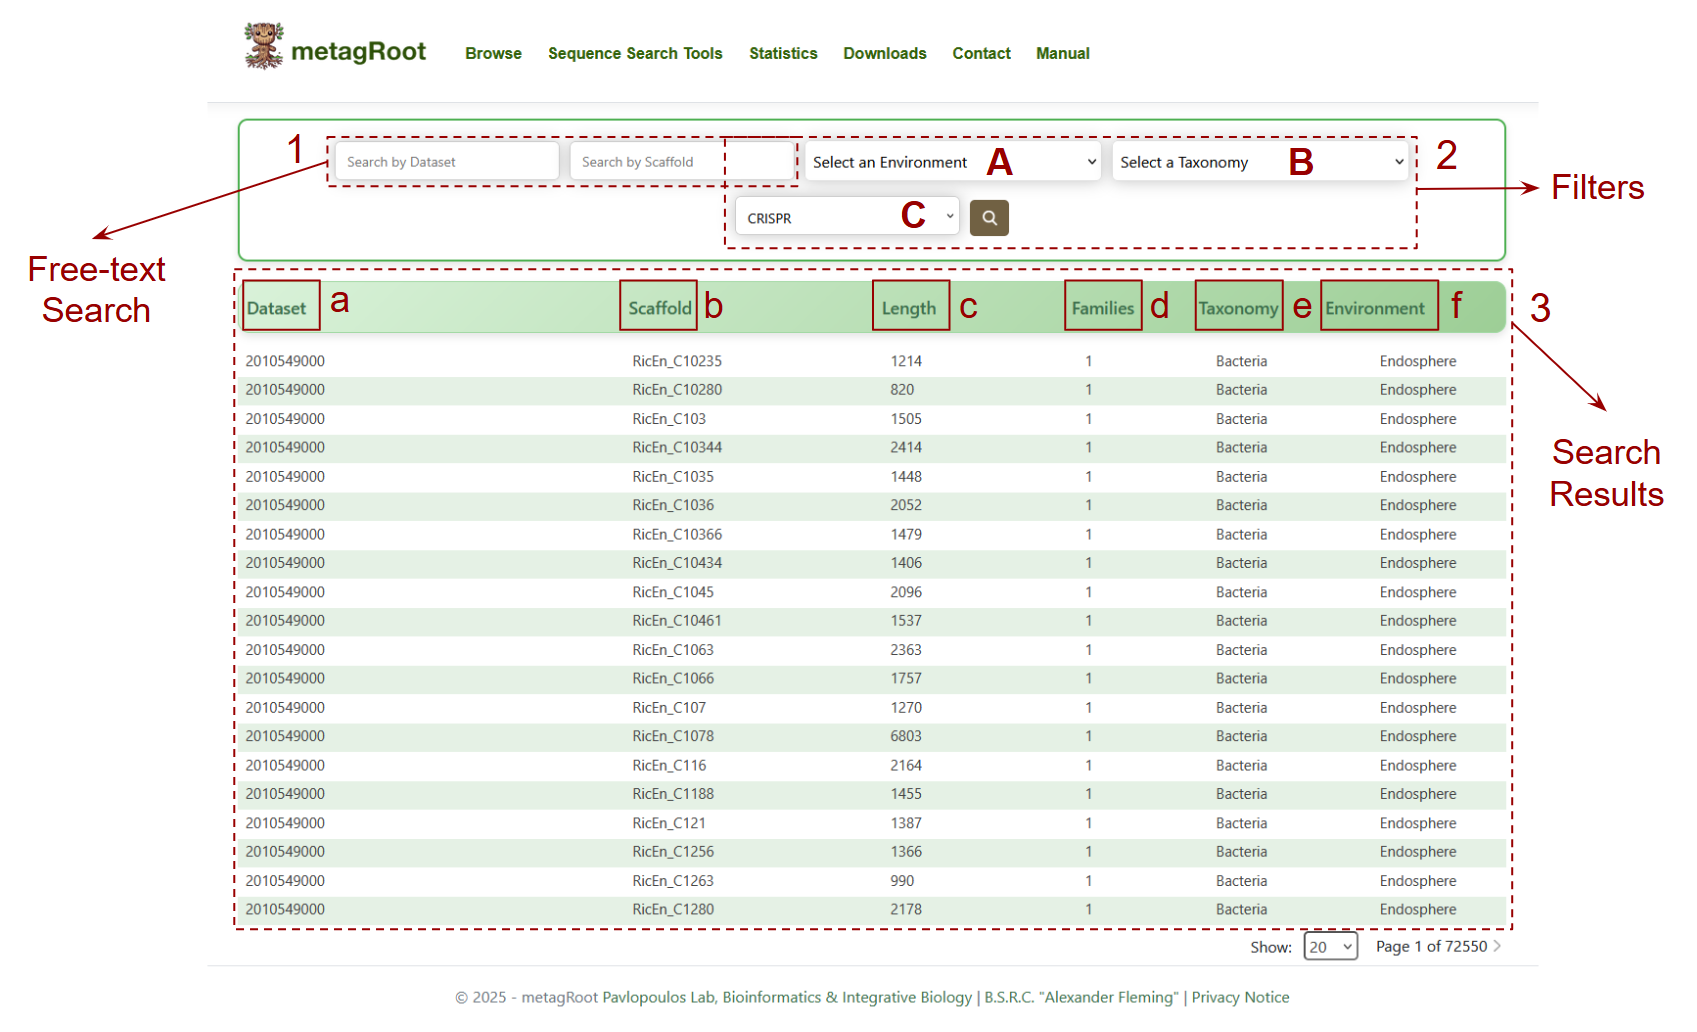
- 1. Free-text Search: Allows users to search scaffolds using specific Dataset or Scaffold IDs.
-
2. Filters: Enables users to narrow down search results by selecting:
- A. Environment
- B.Taxonomy
- C. CRISPR presence (array, domain, or both)
-
3.Search Results: A table displaying scaffolds matching the search criteria.
- a. Dataset: The unique identifier of the dataset from which the scaffold originates.
- b. Scaffold: The unique ID of the scaffold sequence.
- c. Length: The total nucleotide length of each scaffold.
- d. Families: How many protein families are encoded on that scaffold.
- e. Taxonomy: The taxonomic classification assigned to the scaffold.
- f. Environment: The ecological sub environment where the scaffold was found.
-
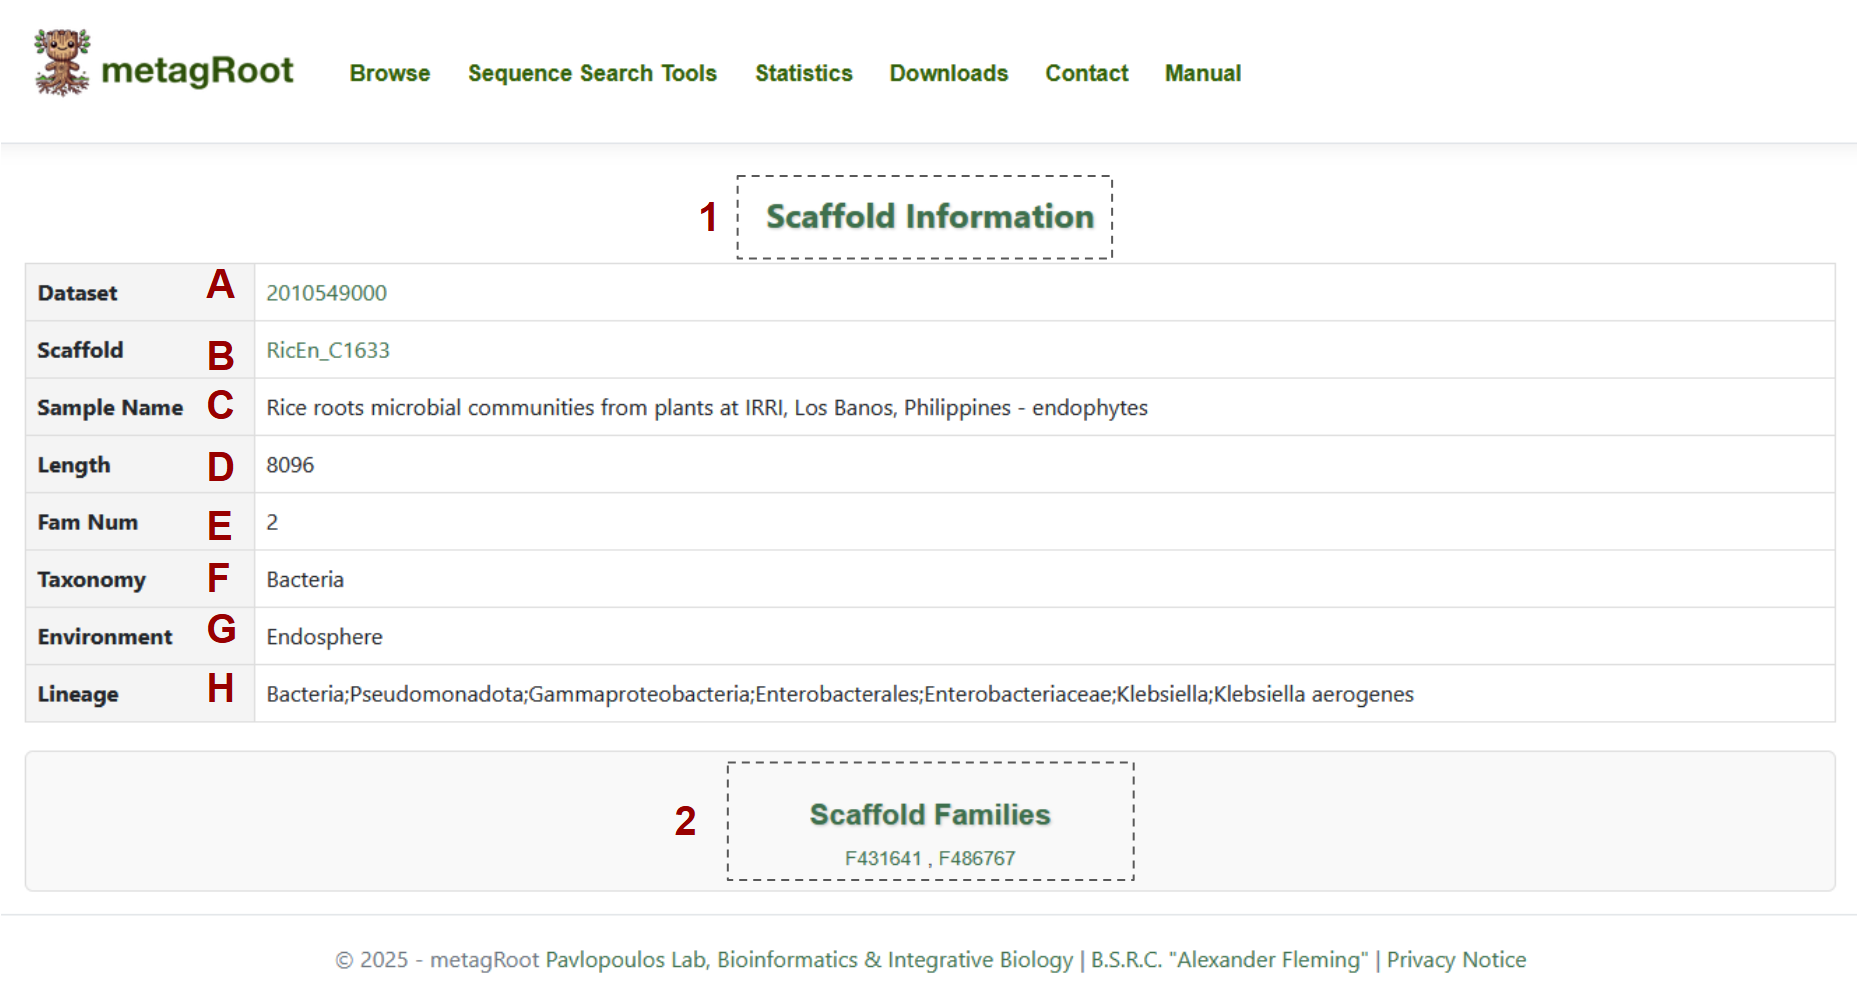
1.Scaffold information table that contains:
- A. Dataset
- B. Scaffold Name
- C. Sample Name
- D. Length
- E. Family Number
- F. Taxonomy
- G. Environment
- H. Lineage
- The Scaffold Families table displays the family names that include proteins originating from the specified scaffolds.

The interactive map view provides a geographic overview of dataset origins, allowing users to explore sample locations globally.
- 1. Search Box: Allows users to search for datasets by name to highlight their geographical origins on the map.
- 2. Zoom Controls: Enables users to zoom in or out to explore dataset locations at different map scales.
- 3. Dataset Pop-up: Displays the IDs of datasets originating from the selected location on the map.
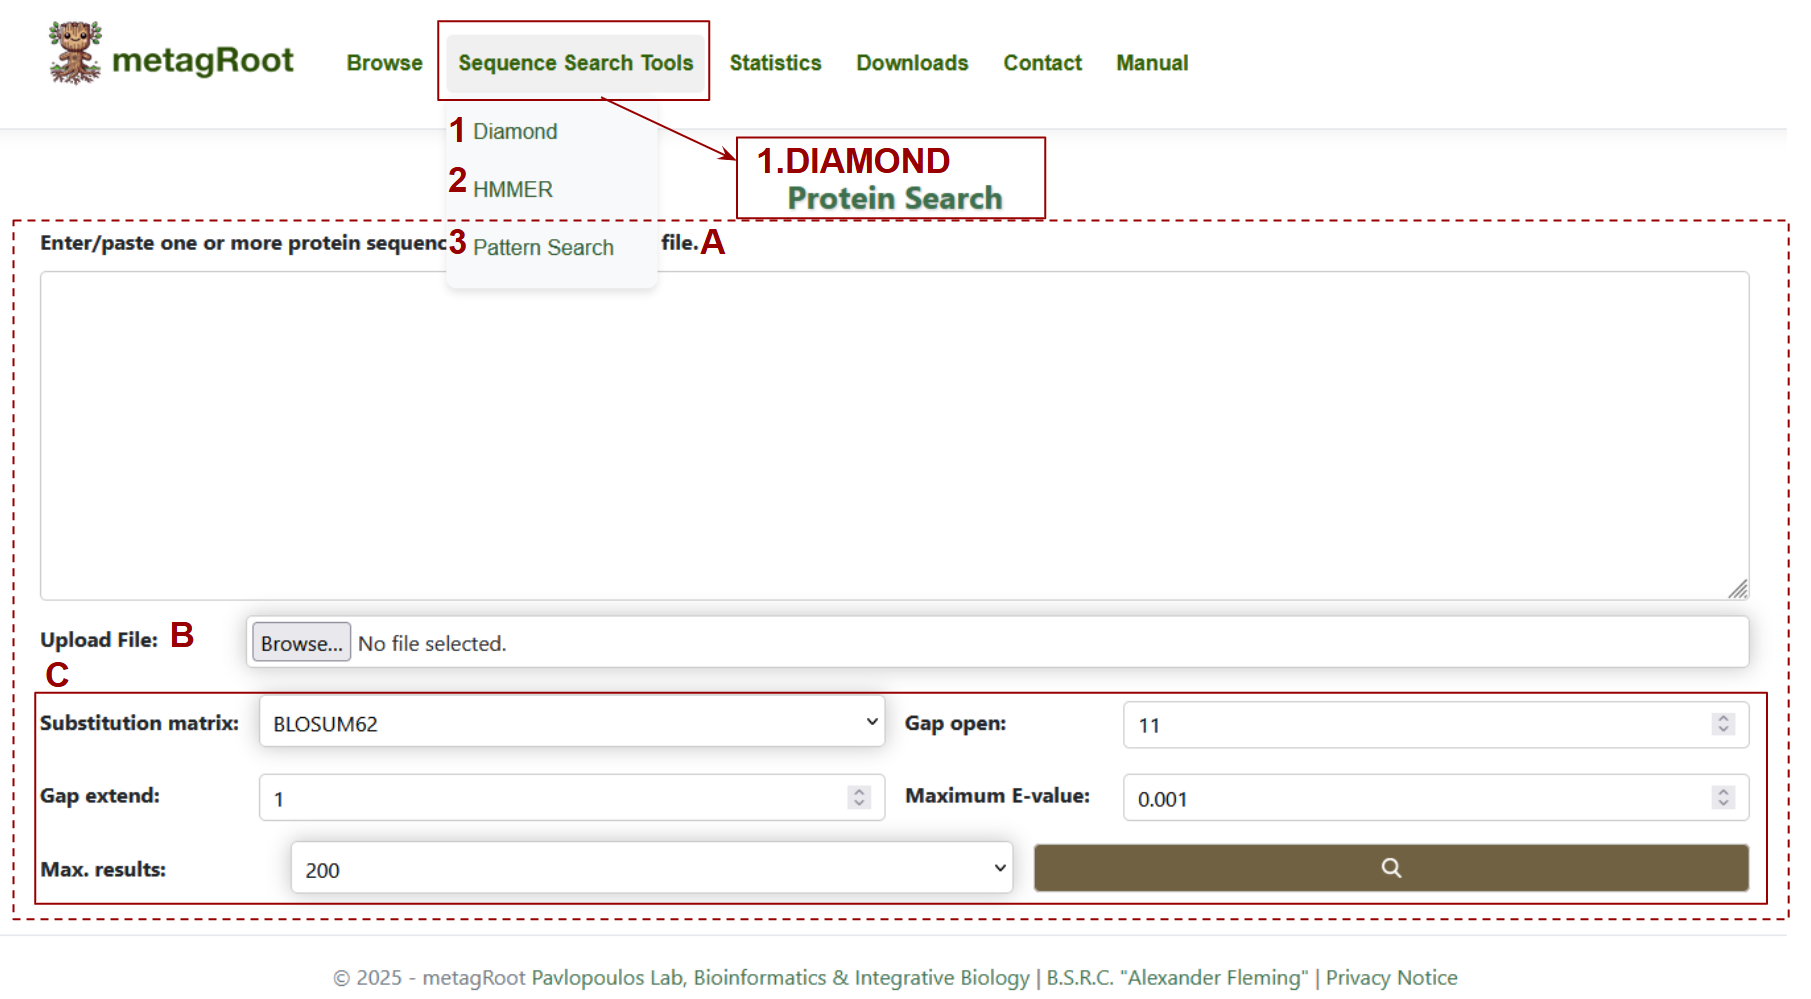
Search Options : The tools available enable sequence alignment, profile searches, and motif pattern detection.
- 1. Diamond:
- 2. HMMER:
- 3. Pattern Search
Selecting DIAMOND opens a page dedicated to protein search:
- A. Text Area: Users can input one or more protein sequences directly into the large text box to initiate a search.
- B. Upload File: Alternatively, users can upload a file containing protein sequences in FASTA format.
- C. Search Parameters: Users can customize the search using parameters such as substitution matrix, gap penalties, E-value cutoff, and result count to refine alignment sensitivity.
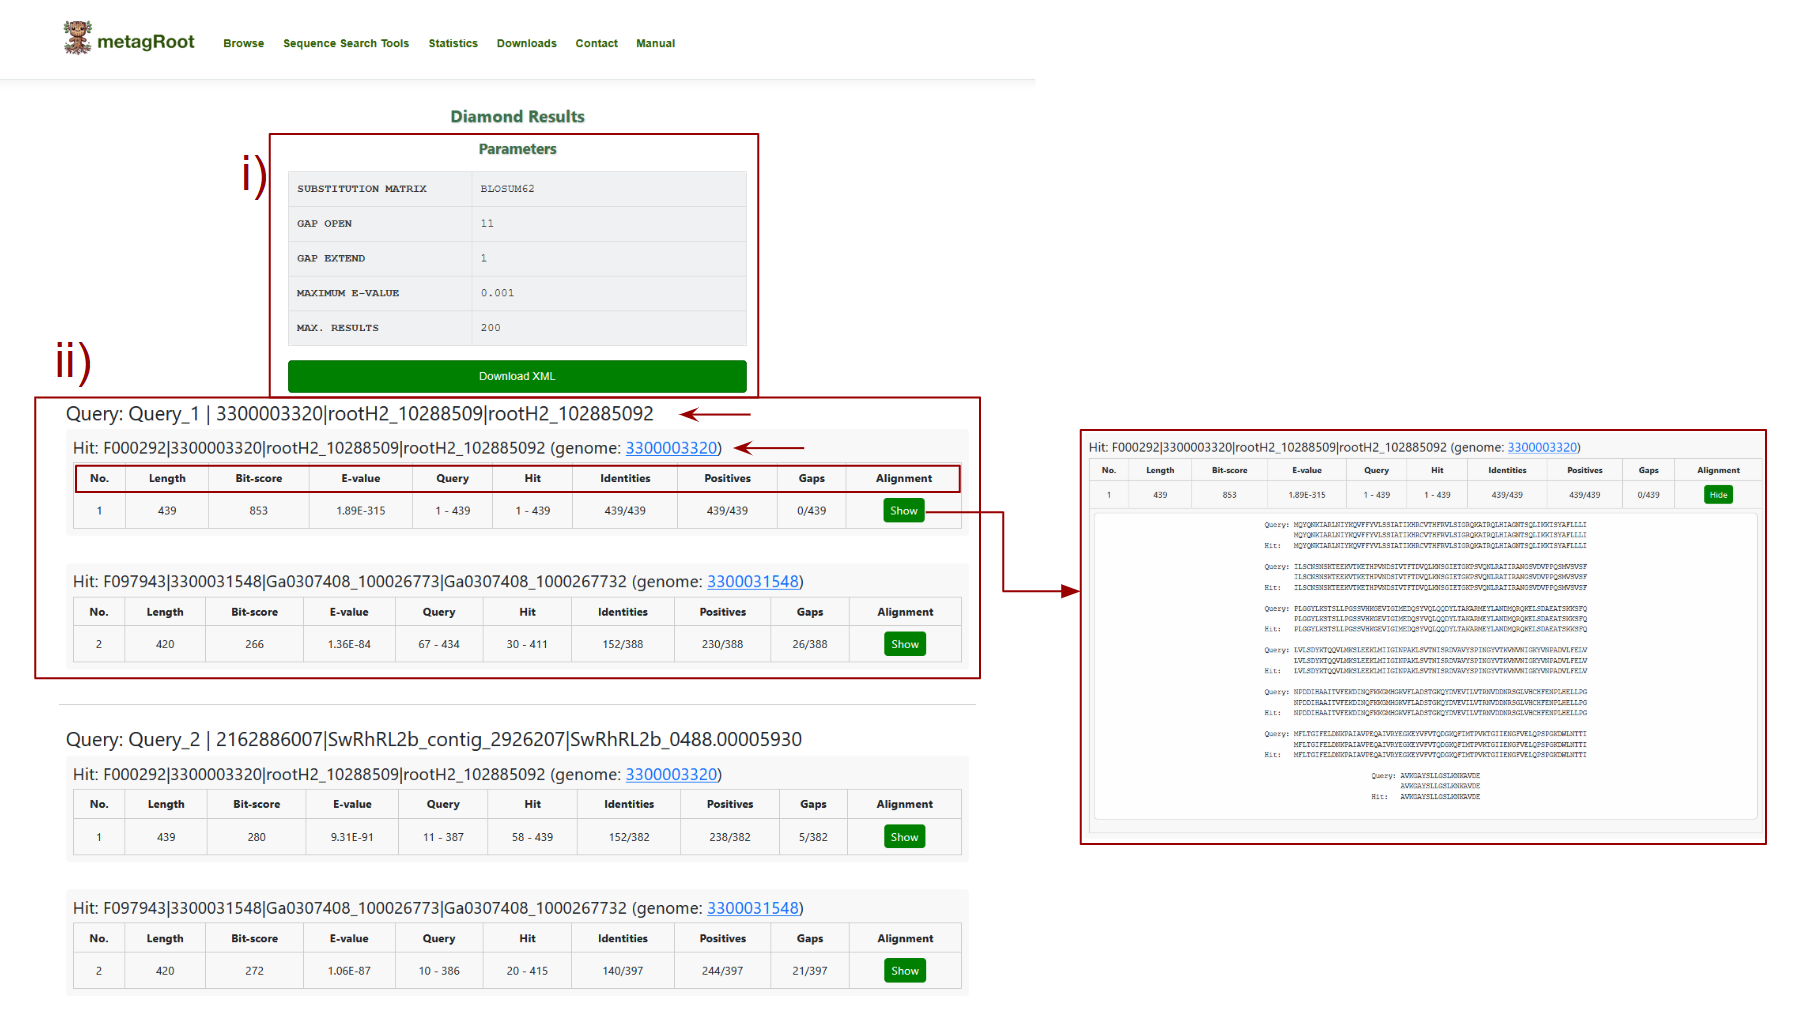
The user can view the results of the Diamond sequence similarity search
- i) This section summarizes the parameters used during the search: the substitution matrix (e.g., BLOSUM62) determines how amino acid replacements are scored, gap open and gap extend penalties control how gaps are penalized in alignments, maximum E-value sets the threshold for statistical significance of matches and max results limits the number of top hits returned.
- ii) This section presents the alignment results for each query sequence, showing details such as bit-score (indicating match quality), E-value (statistical significance), identities (number of exact matches), positives (similar residues), and gaps, along with an option to view the complete pairwise alignment.
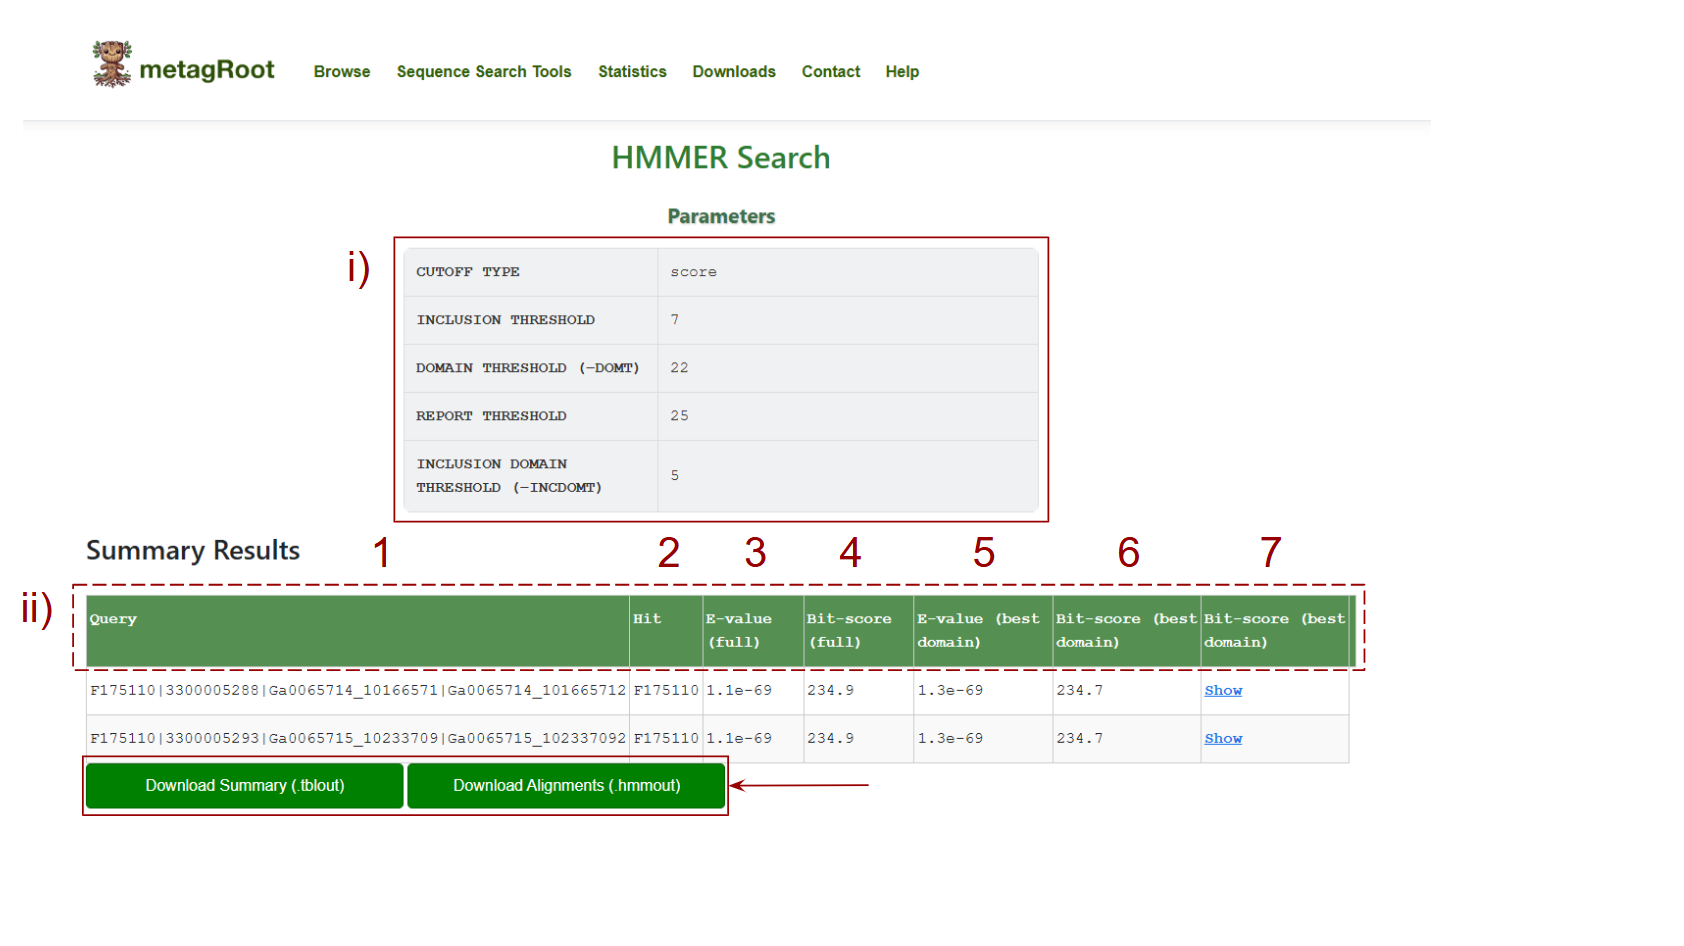
After running an HMMER search, the results page provides both parameter summaries and detailed hit data.
i) Search Parameters Summary At the top of the page, you’ll see the parameters used for your search: Cutoff Type: Defines whether the results are based on Bit-score or E-value. Inclusion Threshold: Minimum threshold for including hits. Domain Threshold: Minimum domain-level threshold for hits. Report Threshold: Minimum value to report hits. Inclusion Domain Threshold: Threshold for including specific domains.
The table below displays detailed alignment data for each query:
- 1. Query: The unique identifier of the query sequence you searched.
- 2. Hit: The identifier for the matched protein family or database sequence.
- 3. E-value (full): The statistical significance of the entire alignment between the query and the hit. Lower values indicate more significant hits.
- 4. Bit-score (full): Indicates the overall match quality across the entire alignment.
- 5. E-value (best domain): The E-value specifically for the best-scoring domain match within the protein.
- 6. Bit-score (best domain):
- 7. The bit-score for the best-aligned domain, highlighting local alignment quality.
Alignment: A download button is available for each row to display the full pairwise alignment between the query and the hit.
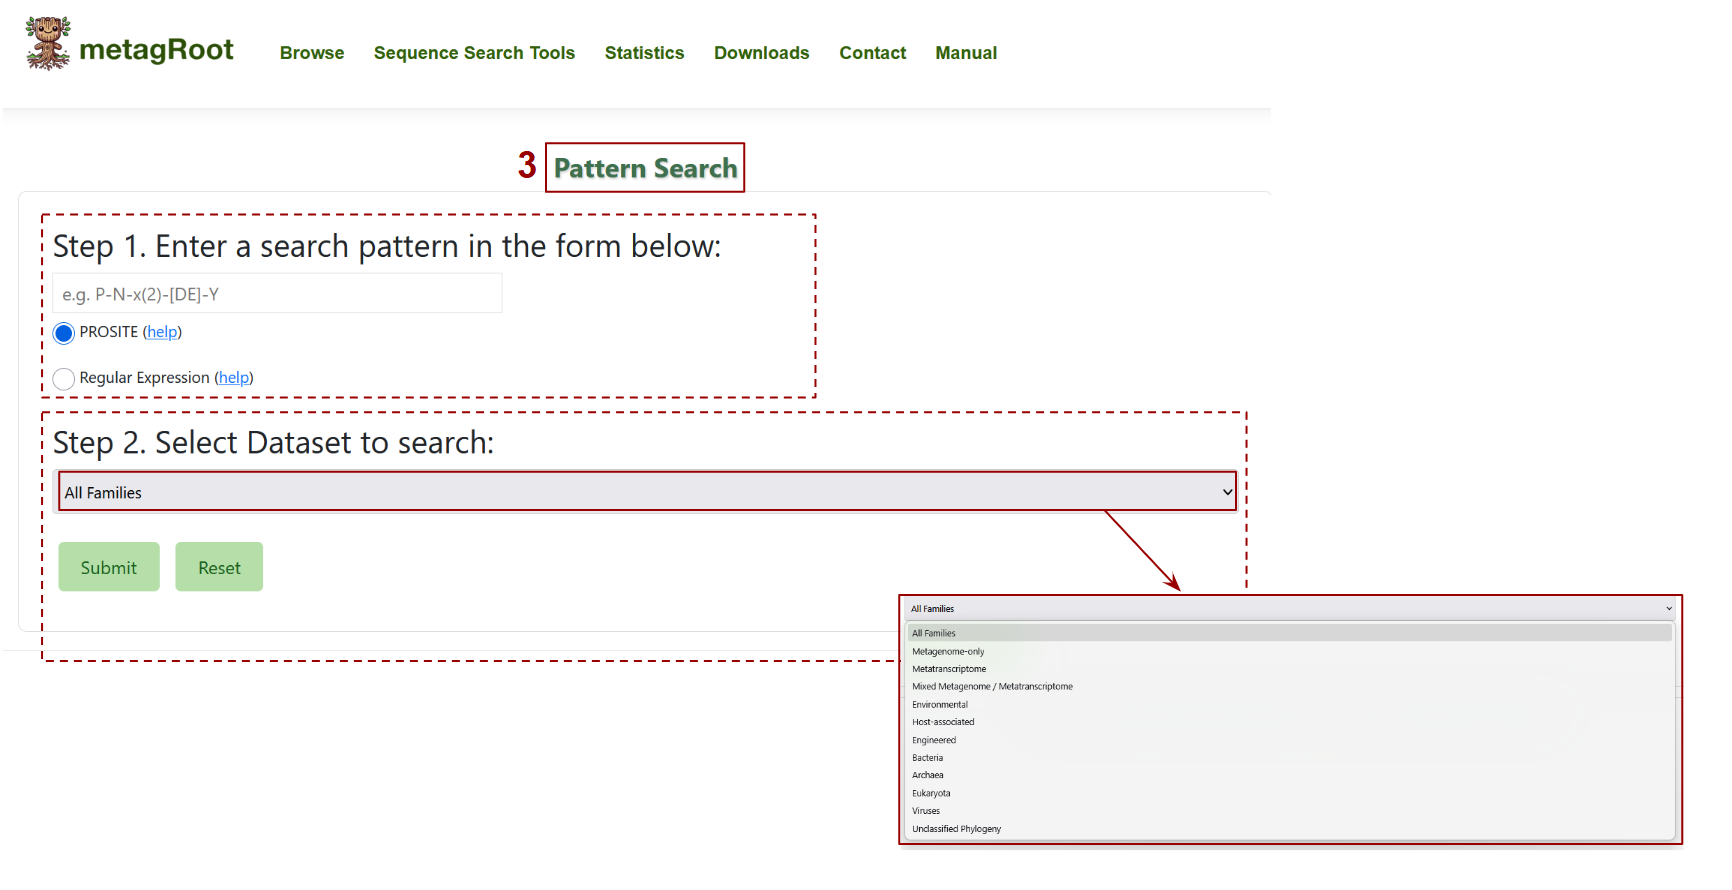
This interface allows users to perform a pattern-based search for protein motifs.
- In Step 1, users can input a pattern using either PROSITE syntax (e.g., P-N-x(2)-[DE]-Y) or a regular expression to define the sequence motif of interest.
- In Step 2, users select the dataset or group of families to search against from a dropdown menu that includes options like "Metagenome-only", "Bacteria", or "Environmental". Submitting the form initiates the search across the selected sequences.
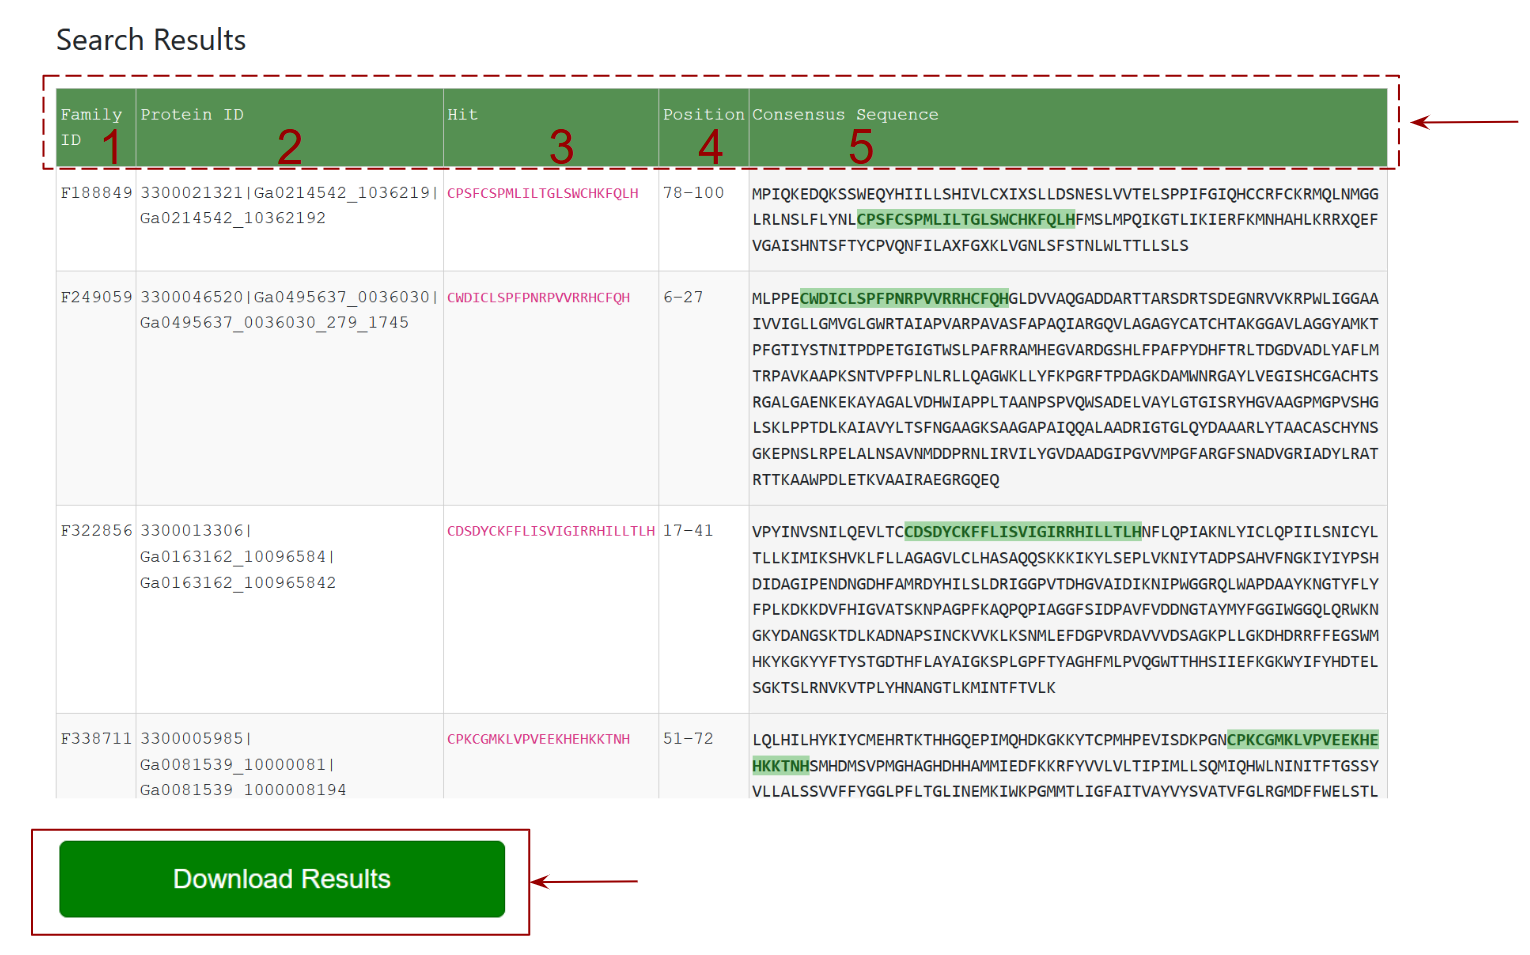
This section presents the results of the Pattern Search, where each row lists a protein family that matches the input motif.
- Family ID: column shows the matched family ids
- Protein ID: column shows the matched associated protein ids
- Hit: column highlights the exact matching subsequence in the protein.
- Position: indicates where in the sequence the match occurs.
- Consensus Sequence: column shows the full protein sequence with the matching motif highlighted in green.
- The Download: button at the bottom allows users to download all results in a file.
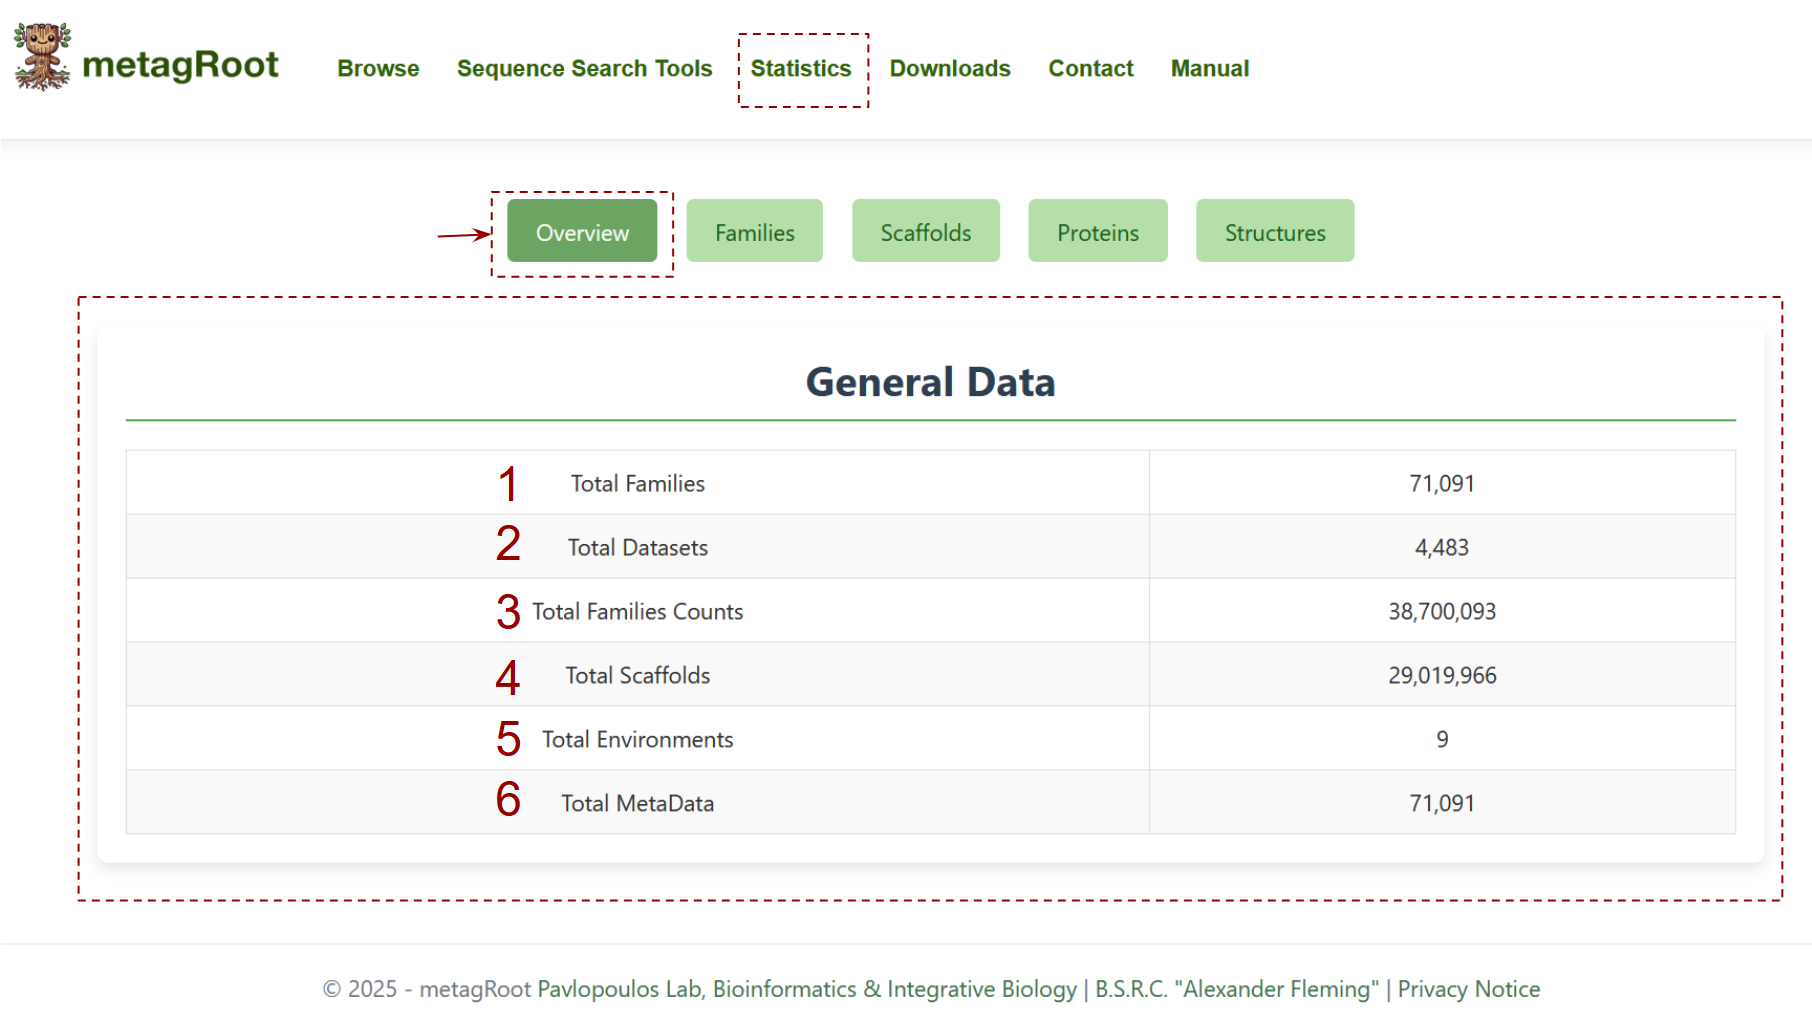
The statistics section provides a summary of statistics about the contents of the metagRoot database Overview tab :
- Total Protein Families
- Total Datasets
- Total Family Counts
- Total Scaffolds
- Total Environments
- Total Metadata Entries
In the Families tab the user can find statistics related to the distribution of protein families across dataset types and environments. The Venn diagram highlights the overlap of families among metagenomes, metatranscriptomes, and isolates.
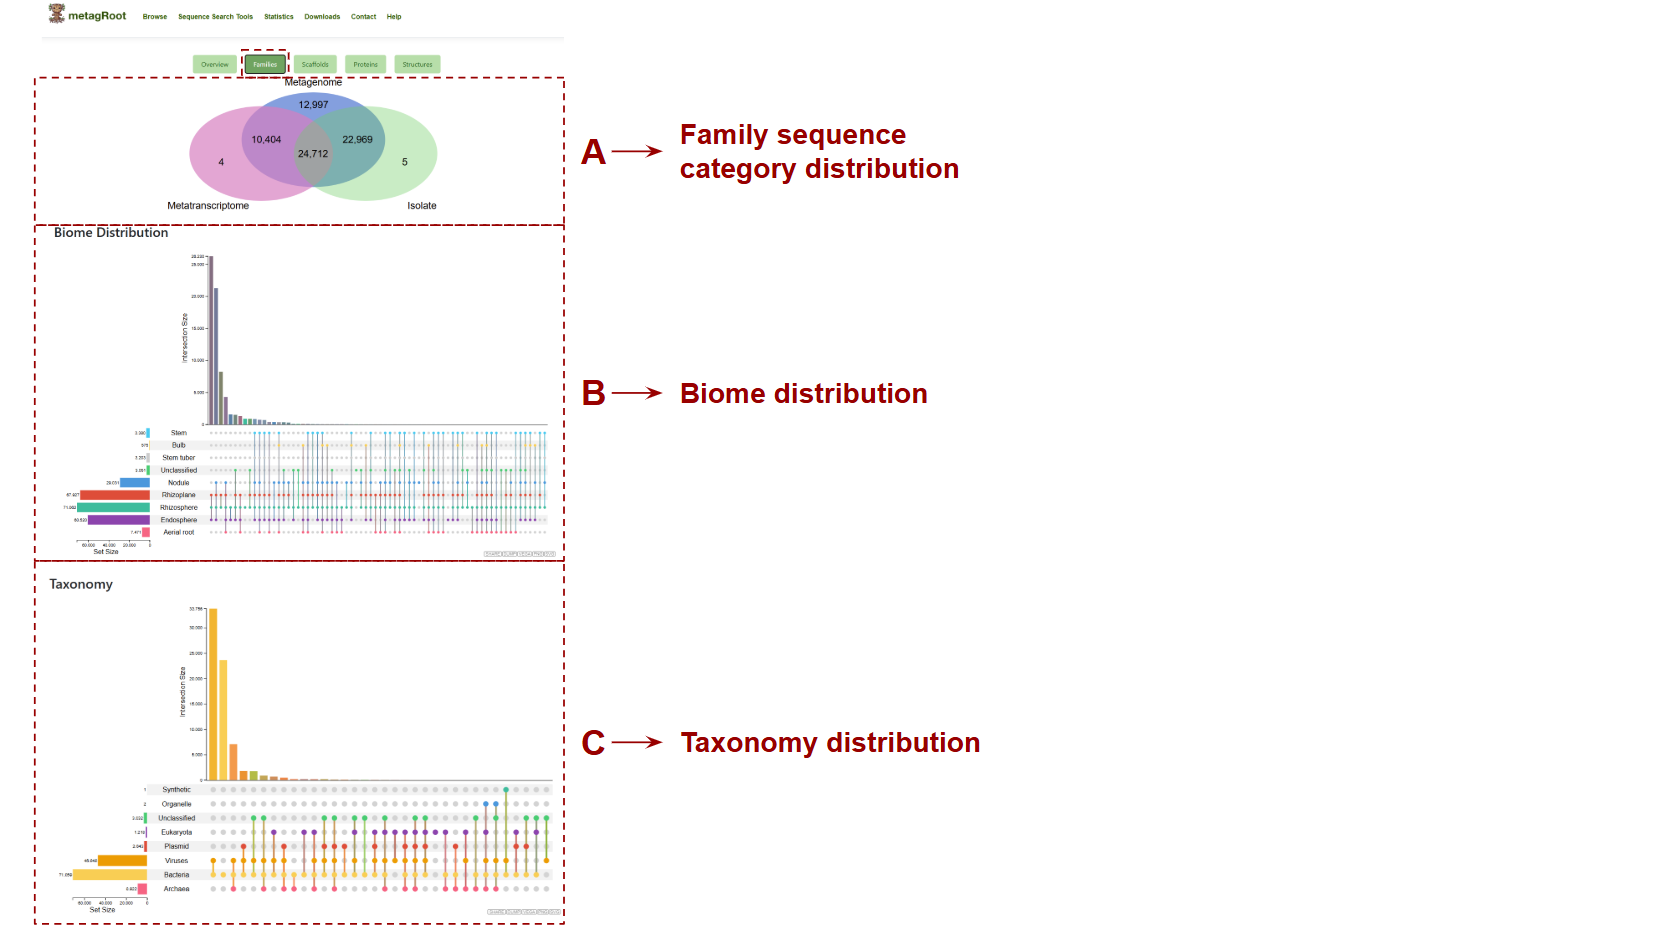
- A. Family sequence category distribution: Shows the overlap of protein families across metagenomes, metatranscriptomes, and isolates.
- B. Biome Distribution: This plot displays the distribution and intersection of protein families across the different sub environments based on user-selected categories.
- C. Taxonomy Distribution: This plot displays the distribution and overlap of protein families across taxonomic groups.
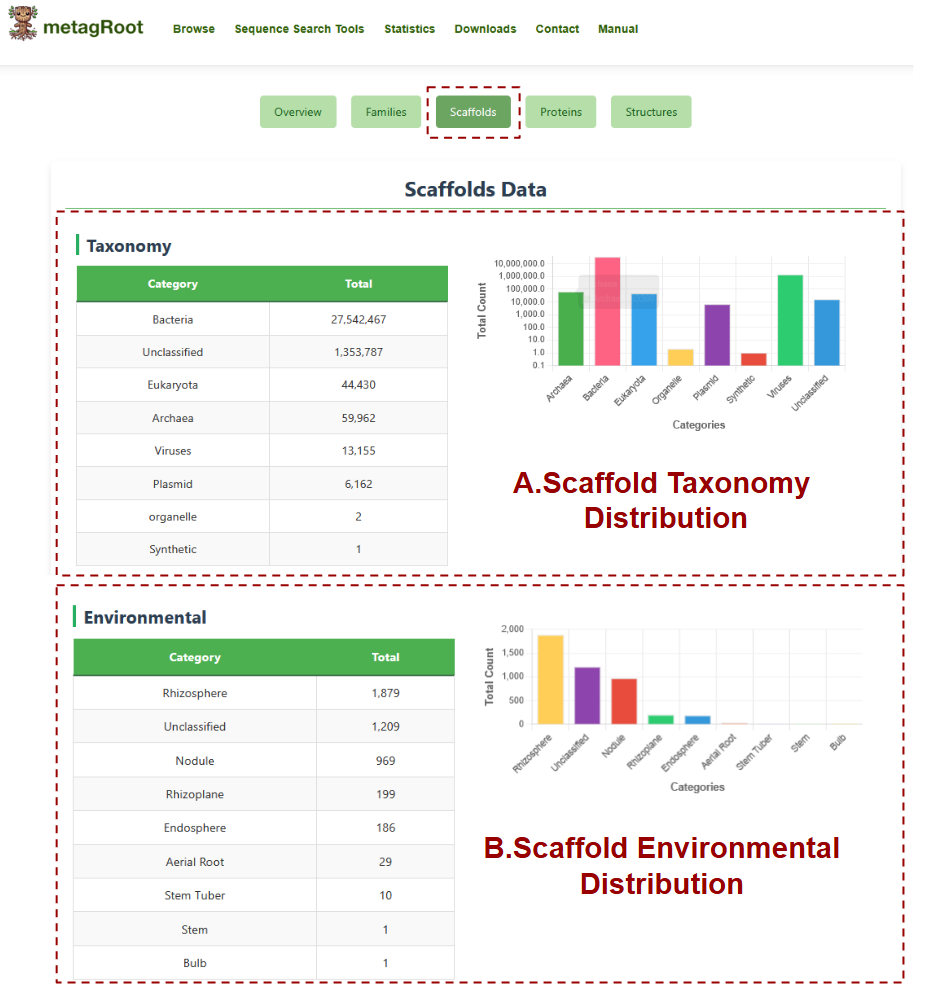
The Scaffolds tab provides an overview of scaffold distribution across taxonomic groups and environmental categories, offering both tabular data and visual summaries.
- A. Scaffold Taxonomy Distribution: This section presents the number of scaffolds classified under different taxonomic categories such as Bacteria, Archaea, Eukaryota, and others, accompanied by a bar chart displaying these totals for visual comparison.
- B. Scaffold Environmental Distribution: This section lists the total number of scaffolds associated with various environmental sources, such as Rhizosphere, Nodule, Endosphere and others, and visualizes their distribution using a bar chart.
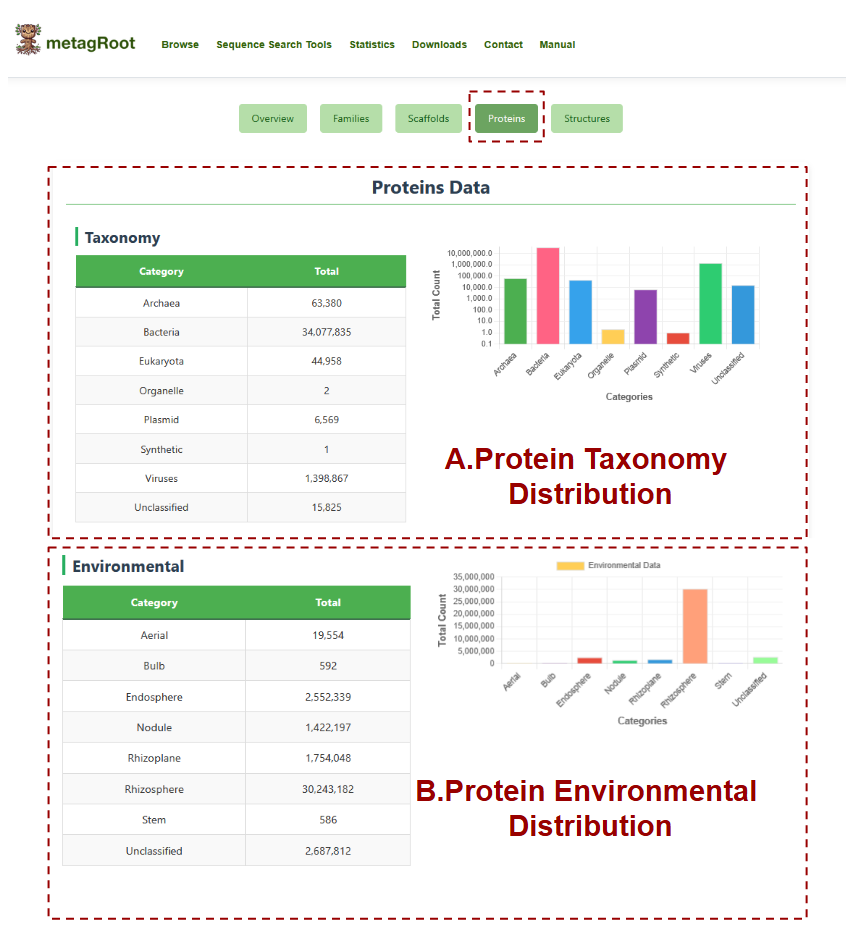
The Proteins tab displays the total number of protein sequences categorized by taxonomy and environment, with accompanying bar charts to help visualize the distribution across different biological groups and ecological niches.
- A. Protein Taxonomy Distribution: Shows the distribution of protein sequences across taxonomic categories.
- B. Protein Environmental Distribution: Summarizes the number of protein sequences originating from the environmental sources such as rhizosphere, nodule, endosphere, aerial tissues, and unclassified environments.
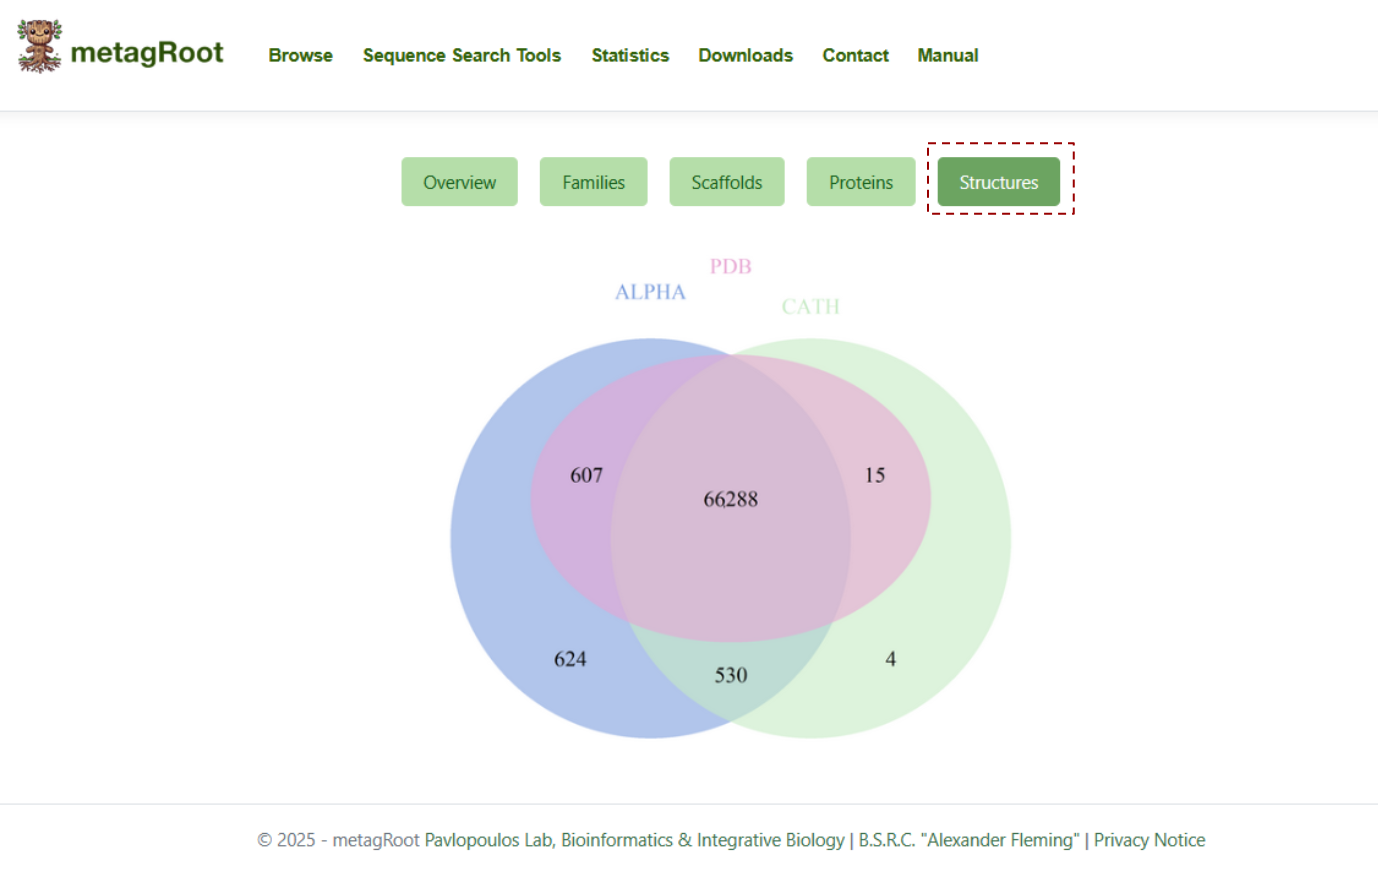
The Structures tab features a Venn diagram showing the unique number of structural hilts from PDB, AlphaFoldDB, and CATH, along with their overlaps.
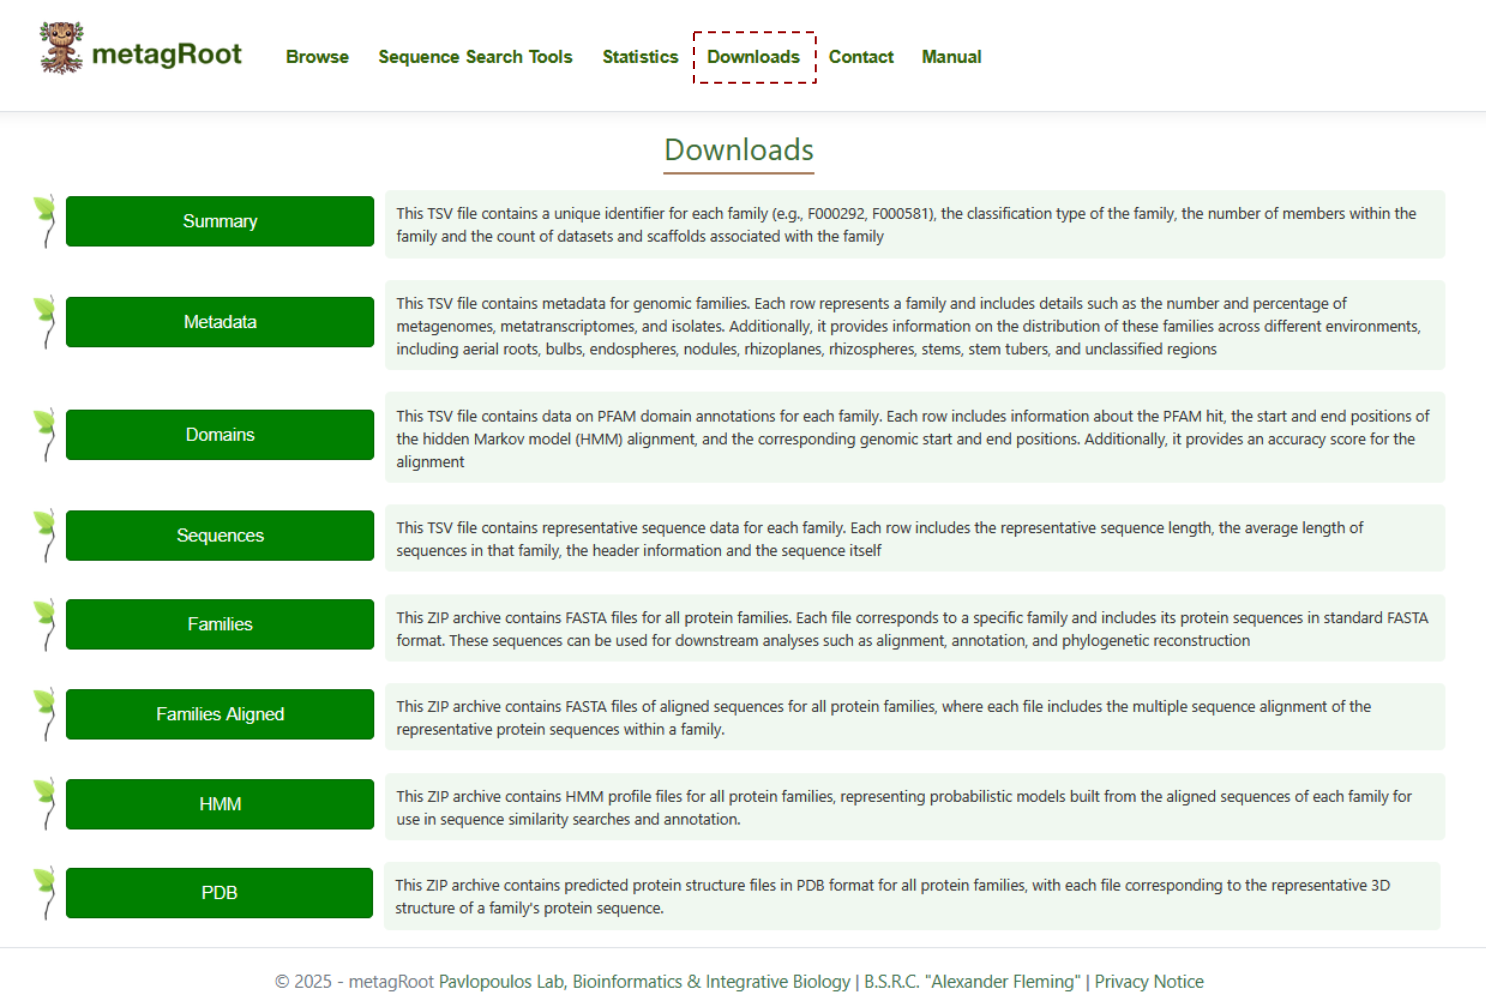
By clicking on the Downloads tab, you can access detailed descriptions of the summary, metadata, domains, sequences, families, aligned families, HMMs, and PDB files, all of which are available for download.